I’m sure we are all aware of the Apache webserver’s dominance. But Apache is just not httpd, it is a vibrant community of software projects. Well, I think we can just let this graph speak for itself:
(click image for larger version)
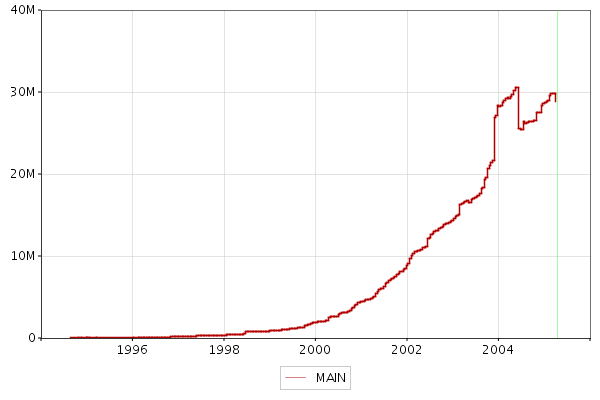
This is the line-count graph of Apache’s CVS repository, generated using FishEye1,2. Random info about this data:
- This graph counts lines in any text file. So it doesn’t represent LOC of source, it is LOC of files (non-binary files). Also, this just HEAD files on MAIN (and not on any other branches, nor deleted files).
- The first commit was in August 1994 (Roy Fielding’s drafts of the URI spec), but the first bit of code wasn’t checked in until January 1996 (the initial import of Apache httpd).
- In the past year, the Apache cvs server has seen between 15,000 and 70,000 commits per month; anywhere from 200 to over 5,000 per day.
- That hiccup (from December 2003 to June 2004) is the Geronimo project entering the Apache incubator and then exiting into its own top level project (and into the Apache SVN repository).
- The graph is drawn from the CVS data of the 169 projects (top-level directories) in the Apache CVS tree.
- That graph looks exponential to me. Open source’s very own Moore’s law? :D
1 We’ve been putting FishEye through its paces on a copy of the Apache CVS repository.
2 We have a plan to team up with Contegix to offer free FishEye hosting for Open Source projects unable to run FishEye themselves. Send us an mail if you might be interested.